Utilizing AWS Serverless stack for webhook delivery at scale

At Solaris, we perform massive amounts of processes on our side — some of which are asynchronous and require us to notify partners and customers about their completion. We employ the classical publisher-subscriber model where we allow partners to provide URLs to be notified about various events, and deliver multiple millions of messages to our partners per day.
As we grew as a company, our implementation was not able to catch up and hit some inherent limitations that made it clear that a rewrite was needed. The legacy solution was only able to scale vertically and not horizontally due to it being a typical web app in ECS (Elastic Container Service).
We guarantee delivery “at least once”, so we naturally offer retries with exponential backoff over a full week after the initial delivery attempt. Under certain conditions, this became an issue: when one of the partners was unable to accept the messages properly, the generated retries saturated the system and starved it of resources for delivering the messages for every one else. Under normal circumstances however, 99% of the messages were successfully delivered within the first 3 attempts, which as you will observe later, had an impact on our architecture.
Another challenge was the pattern of our traffic. Many banking applications work with batch jobs and as we are no exception, we have times of day when our traffic grows 40x in a matter of seconds.
At the same time we have to guarantee that the messages come as close to real time as possible, so first attempt latency is one of the important metrics for judging the system quality.
Architecture

We built our design with 3 key intentions in mind:
- Robustness via scalability
- Fast first delivery attempt
- Containment of late retries separately from first delivery attempts
To reach robustness we decided to go as serverless as possible. You wonder why you see Fargate in the architecture diagram? The Java Fargate is responsible for API and the transformation of the internal system event into one or more external delivery requests. From previous experience, this activity was not a bottleneck so we kept the working design, even though it was a newly introduced application.
Coming back to the serverless components. Once we have a bunch of delivery requests, we utilize the well-known duo SNS+SQS with Python Lambda for calling the partner endpoints. We chose to use Python as the language for the Lambda runtime for its low cold start times, of which we were expected to have quite a few due to high variance in our traffic load. To ensure the database can automatically keep up with the load, we use DynamoDB.
Should there be consistent issues within the first X attempts, the messages get dropped into DLQ (dead-letter queues) and are moved into the slow retry mechanism, which is utilizing AWS Step Function + same AWS Lambda to provide exponential backoff. Remember, we are only talking about 1% of the messages that reach this stage.
Each attempt and its outcome are saved into DynamoDB.
Performance test
Going live with a service which is supposed to serve millions of messages per day without a performance test is not ideal. We wanted to ensure our design successfully withstands the issues that the legacy solutions faced.
To do that we defined 5 difficulty levels = main scenarios, which we wanted to test:
- Normal delivery — 99% success rate on any attempt
- Slow partner — 33% of messages take 0.8 of the timeout time to deliver
- Failing partner — 33% of messages fail all attempts
- Timeout — 33% of messages timeout on all attempts
- Apocalypse — 80% messages take 0.8 of the timeout to fail
To make each of them work we altered the code of the delivery lambda so that it would simulate partner behavior. We used Locust to simulate intensive traffic load.
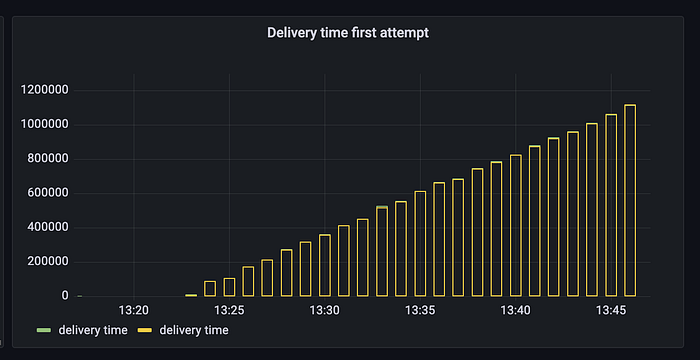
First runs with normal delivery felt like a cold shower: the SQS message count was linearly growing, the first attempt latency jumped into tens of seconds and confidently went to the moon.

We were shocked! The documentation promised scaling and we knew we couldn’t have hit the concurrency limit on the account. As we investigated, we saw that we were right: we barely even scaled to 20 concurrent invocations. This made us RTFM again and we discovered the following passage here: “However, there is a case where Lambda scales down the number of functions, even when there are messages remaining in the queue. This is when a Lambda function throws errors. The Lambda function scales down to minimize erroneous invocations. To sustain or increase the number of concurrent Lambda functions, you must catch the errors so the function exits successfully.” In our naivety we just thought that failing was fine. So we went back to work.
Making lambda gracefully finish regardless of the delivery outcome helped us beat level 1: normal delivery. Nice, 4 more to go! Disregard the cold start at the beginning please.
We went to level 2 “Slow partner”. The implementation aced this one too. Level 3 “Failing partner”? — EZY.
We were growing excited, but it was too soon to celebrate: level 4 “Partner timeout” humbled us down real quick.
Familiar picture, isn’t it? Something was conceptually wrong, we could throw as many resources into it, but we knew it wouldn’t help. So we went to RTFM again.
As we created our first implementation, we thought that batch size of 1 would be a good decision, so that we would not need any complex error handling and management of a mixture of failures and successes in the same batch. Level 4 showed us that we were wrong. Without utilizing batches, we could forget about any good scaling numbers, just the rookie numbers.

So we went and checked what would be a good fit. Turns out, a batch size of 10 is the best, if you do not want to wait for the batch to fill. Once you are over it, you have to provide a batch window: the amount of seconds lambda will wait with an unfilled batch before executing on it. We wouldn’t want to compromise latency, so we went with the AWS default: batch size 10, batch window 0.
This brought some improvement, but the latency was still growing. So we took a step back. If the batch is of size 10, what is the batch duration, assuming all messages time out? 10 times timeout. This would also severely compromise the latency, because the last message would have a huge delay of 9 timeouts. Okay, how can we make this delay 0? Start them all at the same time! But does Python support multithreading, asked the Java developers? Can I create a ScheduledThreadPoolExecutor and submit a Future to it? And Python answered: ye boiii. Even better: there is a special library for IO, which lets you spawn IO requests and wait for their completion! So we went and did it. And voila: level 4 complete with flying colors. We had some unease entering the level 5 “Apocalypse”, but apparently the optimum implementation was reached: the lambdas were scaling as necessary, as we pumped more and more into the API.
Summary
And as every good bedtime story there is a lesson. Lambda is a strong technology, but you’ve got to know what you are doing:
- Do not fail
- Do take advantage of batches
- Use parallelization
Now, as the system is serving multiple millions of messages per day, we already see that we’ve paid for the robustness and sense of security. Our main expenses are:
- Cloudwatch, because we publish a lot of metrics with each batch and attempt
- Step Function, because it is billed in state transitions (and each attempt is a state transition in our design)
- DynamoDB, because each attempt is recorded
As a Java dev, you also should not be tricked by the smooth learning curve of Python: it really is beginner-friendlier than Java, but we still spent quite some time learning to utilize it in an efficient manner. Also, its simplicity is its disadvantage: once the code becomes complex, it is harder to manage without strong typing before runtime.
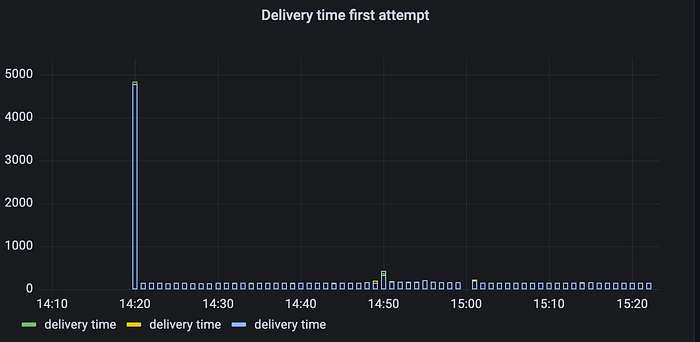
As a closing note, here are some illustrations on how the service performs right now. We process around 2 million internal events, which translates into 4–6 millions of partner interactions per day.

This is how the traffic looks over the course of the day. The p95 for first attempt latency is 150ms, the p98 is 750ms, p99 is 3s. We are able to maintain these impressive numbers regardless of the fluctuation of partner traffic, because they are served by a redesigned for scale and highly robust piece of infrastructure.

